In the first part of the series, we have learnt about Strimzi and deployed a Kafka Cluster on Minikube and also tested our cluster with the console producer/consumer of the Kafka package. In the second part, we have built a producer application with Go and a consumer application with Scala, created Dockerfiles and Kubernetes deployment files and published them to the Kubernetes.
From the look of the logs it seems like our applications and Kafka are performing well. But we had no idea how they are really performing. That’s why we need some monitoring tools to easily monitor our cluster. In the last part of the series, we are going to use Prometheus and Grafana to fulfill our destiny! Now, what are these two really?
This is the Part 3 of the Apache Kafka on Kubernetes with Strimzi blog post. In case you haven’t read the previous posts, I recommend you to check it out:
- Part 1: Creating and Deploying a Strimzi Kafka Cluster on Kubernetes
- Part 2: Creating Producer and Consumer using Go and Scala and deploying on Kubernetes
- Part 3: Monitoring our Strimzi Kafka Cluster with Prometheus and Grafana
Prometheus
Observability is an important aspect in software engineering. Wikipedia explains it very well:
Observability is a measure of how well internal states of a system can be inferred from knowledge of its external outputs.
Wikipedia
Observability plays an important role in the world of microservices. Since there are many moving parts in a microservice architecture that communicate with each other, we need monitoring tools to gather various metrics produced from each component to see how well our system performs and find problems easily so we can optimize our system. These metrics will be stored as time-series data in an optimized storage provided by the monitoring tools. Prometheus is here to help us regarding this issue.
Prometheus is an open-source systems monitoring and alerting toolkit originally built at SoundCloud. Since its inception in 2012, many companies and organizations have adopted Prometheus, and the project has a very active developer and user community.
Prometheus Website
Prometheus collect metrics provided by the components of a system by polling a HTTP endpoint on each of them. There are many libraries for various languages that simplifies the process of producing metrics in applications (For instance, Spring Actuator for Java). Prometheus also provides a powerful query language called PromQL. This query language can be used to select and aggregate time series data in real time and the result of the query can be shown as a graph, table or can be used by other clients to visualize the data. Prometheus has various metric types such as Counter, Gauge, Histogram and Summary.
Another important feature of Prometheus is Labeling. Labels are used to differentiate the data points in metrics. Assume we have a metric named http_requests_total to specify the total number of http requests. We can use a label to differentiate different http requests by their methods: method=”get|post|put|delete”. In case of using microservices, each microservice has its own http_requests_total metric and by using labels. we can categorize them: service=”svc1|svc2|svc3″.
For more information, please visit Prometheus documentation.
Grafana
Grafana is an open source project created by Torkel Ödegaard in 2014. Grafana connects directly to various data sources (time-series databases) and it allows you to query, visualize and explore metrics and also set alerts for different conditions based on the logs.
Grafana is open source visualization and analytics software. It allows you to query, visualize, alert on, and explore your metrics no matter where they are stored. In plain English, it provides you with tools to turn your time-series database (TSDB) data into beautiful graphs and visualizations.
Grafana Documentation
Although Prometheus offers a web UI to view metrics and graphs, Grafana offers much better UI and visualizations which is highly customizable. For example, you can create different dashboards and group various metrics and graphs in them. Also, you can create alerts by defining rules. These alerts can be sent to user via different ways in order to notify them about various conditions defined by the rules.
Just take a look at the Plugins page of Grafana. They support an enormous amount of data sources, panels and applications.
Our Requirements
We need to understand how our producer, consumer and the Kafka cluster behaves in different scenarios. We need to know the number of online brokers and replicas, CPU, memory and disk usage, garbage collection metrics, incoming and outcoming rate of data, etc. And also, details about topics, unconsumed messages and Consumer Lag. It’s highly important to monitor Consumer Lag in Kafka.
Adding Metrics to Kafka
All the YAMLs needed to add metrics to our Kafka cluster are available inside the examples folder inside the Strimzi package.
First of all, we need to add metrics to our Kafka resource. Open excamples/metrics/kafka-metrics.yaml file. As you can see, it has metrics key for both kafka and zookeeper. Add them to our Kafka resource yaml file. Now, we also need to add Kafka Exporter configs to our Kafka resource. Visit the Kafka Exporter page on Strimzi document for more information. Kafka Exporter is an open source library used by Strimzi to enhance the monitoring of Kafka brokers and clients.
Our final Kafka resource file will look like this:
apiVersion: kafka.strimzi.io/v1beta1
kind: Kafka
metadata:
  name: my-cluster
spec:
  kafka:
    version: 2.6.0
    replicas: 1
    resources:
      ...
    metrics:
      lowercaseOutputName: true
      rules:
        ...
  zookeeper:
    replicas: 1
    ...
    metrics:
      lowercaseOutputName: true
      rules:
       ...
  kafkaExporter:
    groupRegex: ".*"
    topicRegex: ".*"
    logging: debug
    enableSaramaLogging: true
    readinessProbe:
      initialDelaySeconds: 15
      timeoutSeconds: 5
    livenessProbe:
      initialDelaySeconds: 15
      timeoutSeconds: 5
Strimzi uses Prometheus JMX Exporter to expose JMX metrics using an HTTP endpoint, so it can be scraped by the Prometheus server.
Now, let’s update our Kafka resource by applying the yaml file:
$ kubectl apply -f kafka-deployment.yaml -n kafka
Deploying Prometheus
Same as Kafka Cluster, We are using Operators to deploy Prometheus on Kubernetes.
Introducing Prometheus Operator
With Prometheus Operator, you can deploy and use Prometheus on Kubernetes as easy as possible. Same as the Strimzi Operator that watches for specific resources (e.g. Kafka, KafkaTopic, etc) and reacts on them, the Prometheus Operator does the same. The Operator acts on these resources:
- Prometheus. Defines a desired Prometheus deployment.
- ServiceMonitor. Defines how a dynamic set of services should be monitored
- PodMonitor. Defines how a dynamic set of pods should be monitored
- AlertManager. Defines a desired Alertmanager deployment.
- PrometheusRule. Defines a desired Prometheus rule to be consumed by one or more Prometheus instances.
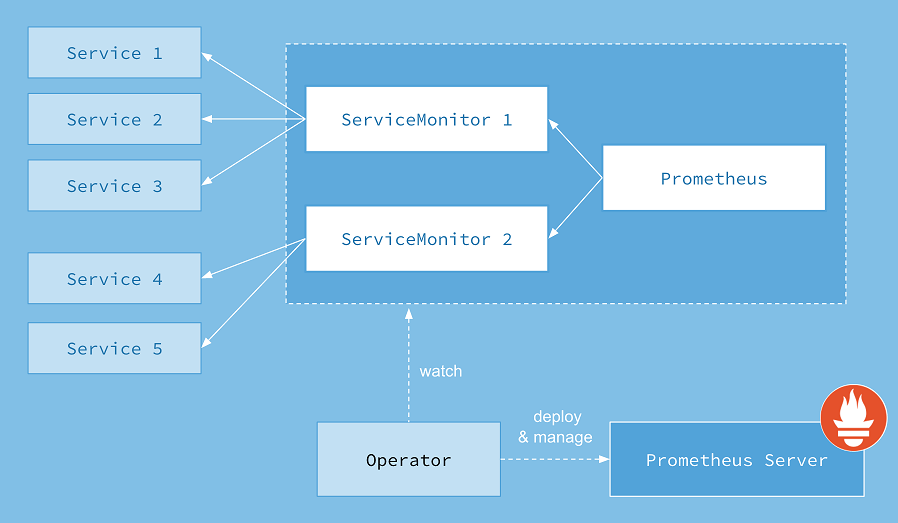
We’re going to explain them in details with examples soon. Now, let’s deploy the Prometheus Operator. In case you don’t know that if you should use ServiceMonitor or the PodMonitor, visit this link.
Deploying Prometheus Operator
Download the Prometheus Operator deployment bundle file from here. This yaml file contains all the resources needed to deploy the Prometheus Operator. Before deploying, you need to replace the default namespace used inside the yaml file with your own namespace (we are using monitoring namespace). If you are using Linux or MacOS, you can use curl and sed commands to easily download the bundle.yaml file and replace the namespace (commands are taken from Strimzi document with a slight change):
Linux:
$ curl -s https://raw.githubusercontent.com/prometheus-operator/prometheus-operator/master/bundle.yaml | sed -e 's/namespace: .*/namespace: monitoring/' > bundle.yaml
MacOS:
$ curl -s https://raw.githubusercontent.com/prometheus-operator/prometheus-operator/master/bundle.yaml | sed -e '' 's/namespace: .*/namespace: monitoring/' > bundle.yaml
Now, let’s deploy it:
$ kubectl apply -f bundle.yaml -n monitoring
Lets see if our Operator has been deployed successfully:
$ kubectl get pods -n monitoring
NAME                                   READY   STATUS    RESTARTS   AGE
prometheus-operator-7568575f58-2phj6   1/1     Running   0          1m

$ kubectl get svc -n monitoring
NAME                  TYPE        CLUSTER-IP   EXTERNAL-IP   PORT(S)    AGE
prometheus-operator   ClusterIP   None         <none>        8080/TCP   1m
Deploying Prometheus
Strimzi provides all the example resources needed for deploying Prometheus inside the examples folder. Head to the examples/metrics folder. Before deploying the main Prometheus resource, we need to add some other resources. We are going to deploy all the files inside the monitoring namespace.
First, open prometheus-additional-properties folder. We need to add prometheus-additional.yaml file as a Kubenetes Secret. This additional configuration contains configuration for a cadvisor. A cadvisor is an agent that monitors resource usage and analyzes the performance of containers.
The Grafana dashboards provided inside the examples folder show metrics for CPU, memory and disk volume usage, which come directly from the Kubernetes cAdvisor agent and kubelet on the nodes. The Prometheus does not have monitoring resource like PodMonitor for scraping the nodes. So this configuration file is needed. It is also referenced inside the Prometheus deployment file:
$ kubectl create secret generic additional-scrape-configs --from-file=prometheus-additional.yaml -n monitoring
Second, open up strimzi-pod-monitor.yaml file. This file contains PodMonitor resources. PodMonitor is used to scrape data directly from pods. For our case, it means pods of Apache Kafka, ZooKeeper and Operators. Update the namespaceSelector.matchNames property and add the namespaces where the pods that the Prometheus needs to scrape. In our case, it’s the kafka namespace.
  namespaceSelector:
    matchNames:
- kafkaThird, Open the prometheus.yaml file inside examples/metrics/prometheus-install folder. Update all namespace properties and add our monitoring namespace. This file includes the main Prometheus resource that we need to install and run the Prometheus. As you can see in this file, it points to the additional-scrape-configs secret that we have deployed recently in the additionalScrapeConfigs property.
Now, deploy all the updated files:
$ kubectl apply -f strimzi-pod-monitor.yaml -n monitoring
$ kubectl apply -f prometheus-rules.yaml -n monitoring
$ kubectl apply -f prometheus.yaml -n monitoring
The prometheus-rules.yaml file resides in the examples/metrics/prometheus-install folder and contains PrometheusRule resource that defines a desired Prometheus rule to be consumed by one or more Prometheus instances.
Wait until the pods are up and running:
$ kubectl get pods -n monitoring
NAME                                   READY   STATUS    RESTARTS   AGE
grafana-7b7bfd6ffc-lmg6z               1/1     Running   0          118m
prometheus-operator-7568575f58-2phj6   1/1     Running   1          19h
prometheus-prometheus-0                3/3     Running   1          98m
Now, our Prometheus instance is up and running. We have also configured the metrics that our Kafka cluster is exporting and also with the PodMonitor instances and the PrometheusRule that we have configured, Prometheus can scrape metrics from pods inside our kafka cluster.
Deploying Grafana
Let’s deploy Grafana and connect it to our Prometheus instance. The Strimzi also provides a configuration file for deploying Grafana. Head to the examples/metrics/grafana-install folder and deploy the grafana.yaml file.
$ kubectl apply -f grafana.yaml -n monitoring
Now, lets use port forwarding to have access to the Grafana dashboard. Use the following command for port forwarding:
$ kubectl port-forward svc/grafana 3000:3000 -n monitoring
Open http://localhost:3000 inside your browser and add Prometheus as a new Data Source. Inside the Settings tap, you need to enter Prometheus address. Let’s see what is the address of our Prometheus service inside Kubernetes:
$ kubectl get svc -n monitoring
NAME                  TYPE        CLUSTER-IP      EXTERNAL-IP   PORT(S)    AGE
grafana               ClusterIP   10.103.151.53   <none>        3000/TCP   132m
prometheus-operated   ClusterIP   None            <none>        9090/TCP   112m
prometheus-operator   ClusterIP   None            <none>        8080/TCP   19h
The address we need to use is http://prometheus-operated:9090. Since the Grafana also resides inside the monitoring namespace, this address is enough. But to access it from another namespace, you need to enter the fully qualified name: http://prometheus-operated.monitoring:9090 or http://prometheus-operator.monitoring.svc.cluster.local:9090
Now, we need to add some Dashboards to Grafana. Go to the install/metrics/grafana-dashboards and import these files through the Grafana webpage:
strimzi-kafka.json
strimzi-kafka-exporter.json
strimzi-operators.json
strimzi-zookeeper.json
We haven’t added other Strimzi components like Kafka MirrorMaker so no need to add it.
Now, open the imported Dashboards. As you can see, we can easily monitor our Kafka, Zookeeper and Operators inside Grafana, Awesome!
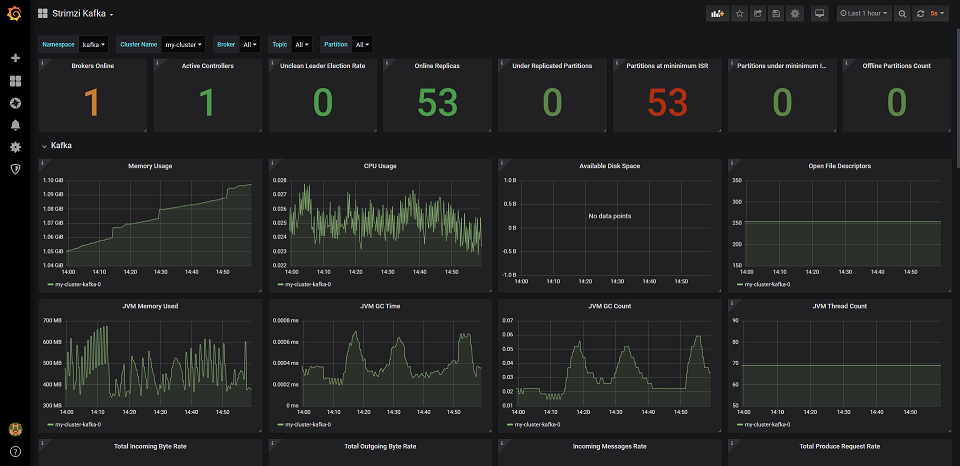
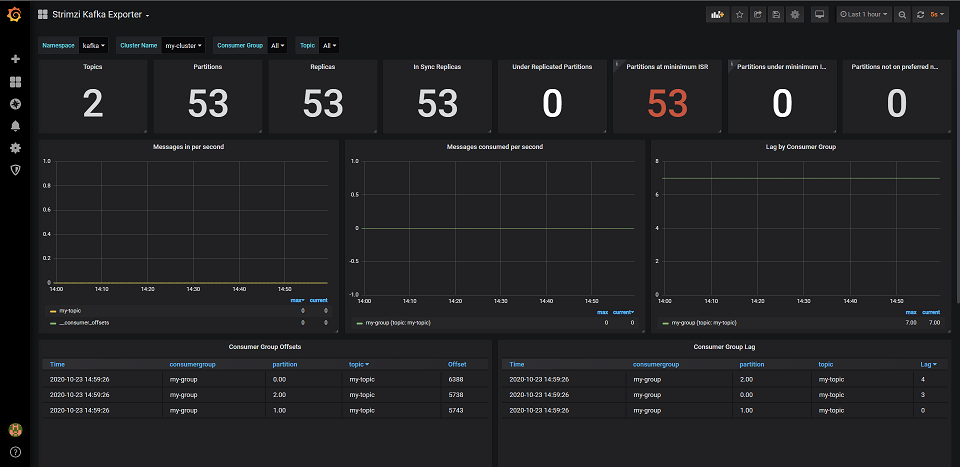
As you have seen in the previous post, we have added sleep-time config to our Producer and Consumer. You can easily play with this config to control the speed of producing and consuming and see how your Kafka Cluster behaves under various load. Consumer Lag can be easily spotted in Strimzi Kafka Explorer Dashboard.
Conclusion
In this blog post series, we have learnt how to Deploy a Kafka cluster using Strimzi, writing Producers and Consumers with Go and Scala, deploying them in Kubernetes and connecting to our Kafka cluster and in this post, we have learnt how to add metrics to our Kafka and ZooKeeper, deploy Prometheus and Grafana and configure it to scrape metrics from our Pods.
The deployment files and the producer and consumer source code is available here: https://github.com/nrsina/strimzi-kafka-tutorial
Hope you have enjoyed this post and learnt a thing or two 🙂 If you have any questions or suggestions, feel free to ask in the comment section or send an email to me.
Hi Sina,
Thanks for sharing the knowledge, this is a really great post! I was wondering how to change the Prometheus data retention period from the default 24 hour period to something like 3 weeks. I have tried adding the “retention: 21d” line to the prometheus.yaml file and applying it but the data still continues to roll off every 24 hours.
Thanks,
Peter
Hello Peter,
Sorry for answering really late! I don’t know why I missed your comment and didn’t notice. Actually, I’m not a DevOps and I’m mostly a programmer who is interested in Kubernetes stuff. So unfortunately I can’t answer this question as I haven’t worked much with Prometheus and mostly used the default properties and I have to search it myself. Sorry.
Thank you 🙂
[…] Part 3: Monitoring our Strimzi Kafka Cluster with Prometheus and Grafana […]
Thanks! It helps me a lot.
I am getting follow error when i am trying to apply .yaml file
kubectl apply -f bundle.yaml -n monitoring
W0610 09:41:01.425940 28682 gcp.go:120] WARNING: the gcp auth plugin is deprecated in v1.22+, unavailable in v1.25+; use gcloud instead.
To learn more, consult https://cloud.google.com/blog/products/containers-kubernetes/kubectl-auth-changes-in-gke
error: error parsing bundle.yaml: error converting YAML to JSON: yaml: line 4306: did not find expected key
issue sorted out.. there was ideomtation issue in the.yaml file.
My prometheus instance is not coming up after completing the “Deploying Prometheus” step , not sure how we can troubleshoot or where things goes wrong ..
current status is only prometheus operator is running.
NAME READY STATUS RESTARTS AGE
prometheus-operator-67cf85bff4-bkrqg 1/1 Running 0 30m
Could you please help to sort out this issue.
Regards,
Sagar Vyas